How to Make $1,200 with R
“How much should I rent my condo for?”
Turns out, the answer is: “Guess.”
So, I built the data-driven solution this problem.
Our family has spent the last year trying to buy a house in Seattle, and we’ve finally hit the mark and we’re moving in a couple week. But, what should we do with our condo? We’ve decided to keep it, and rent it out. But, as a mediocre software engineer and a person obsessed with data, how should I go about it? Zillow has rental zestimates, but they seem to be really lagging. Guessing didn’t seem right. So, I’ll do my own.
Getting the Data #
I know craigslist is the king of rental listings, so I went there to see if I could find some units comparable to mine. Turns out, it was super easy, I just filtered it to “queen anne” units with 2+ bedrooms. And, there is an associated RSS feed for this page now too.
Here is my example search, and the associated RSS.
This list is neither comprehensive nor perfect. But, definitely good enough to make this as a proof-of-concept and help me figure out the value of my unit.
Formatting the Data #
I’ve chosen to use R as my tool of choice to do this analysis, because (a) everybody else seems to be using it, and (b) I think it’ll make what I want to do super easy. Unfortunately, I’m damn-near illiterate in R, and I’m too stubborn to read an intro or anything. So, I muddled my way through on my little knowledge and a lot of hacks.
The second (and almost always the hardest) step in a problem like this is getting the data into a “learnable” format. I had the data as an RSS, but how could I get that into R? Well, I had to figure out how to turn it into a CSV, because that’s the only way I know how to get data into R.
If you don’t know, there are a couple of amazing functions in Google Spreadsheet that make web scraping easy (and RSS scraping borderline illegal): ImportXML, ImportHTML, ImportFeed and ImportData.
In cell A1, I put this formula:
=importFeed(“http://seattle.craigslist.org/search/apa?bedrooms=2&catAbb=apa&query=queen%20anne&s=0&format=rss”)
And, I instantly had 20 rows of data from craigslist. Now, for some things to regress on. Based purely on intuition (thanks Andrew Ng for using that word so often during the Coursera Machine Learning class) and effort-level required to extract the data, I was going to build a model on:
- Square footage
- number of bed rooms
- number of bathrooms
There are a couple of other things that I’d like to take into account later, but haven’t had the time to yet: WalkScore, year built and quality (judging the pictures)
With a couple of simple formulas, I was able to get the easy stuff out:
Price:

=iferror(REGEXEXTRACT(A2,”\$(….)”),””)

Square footage:

=iferror(REGEXEXTRACT(A2,”([0-9]{3,4})sqft”),””)

Number of bedrooms:

=iferror(REGEXEXTRACT(A2,”(.)bd”)&”bed”,””)

Number of bathrooms: =iferror(REGEXEXTRACT(A2,”(\d)\s{0,1}ba”)&”bath”,””)
Turns out the number of bathrooms was unusable because the number is not in a standardized format in the title like the others. So, I ended up excluding it from my model because it wouldn’t have been able to contribute anything. Also, bathrooms are usually listed as: 1, 1.25, 1.5, 1.75, 2, 2.25, etc… so this regex doesn’t work well
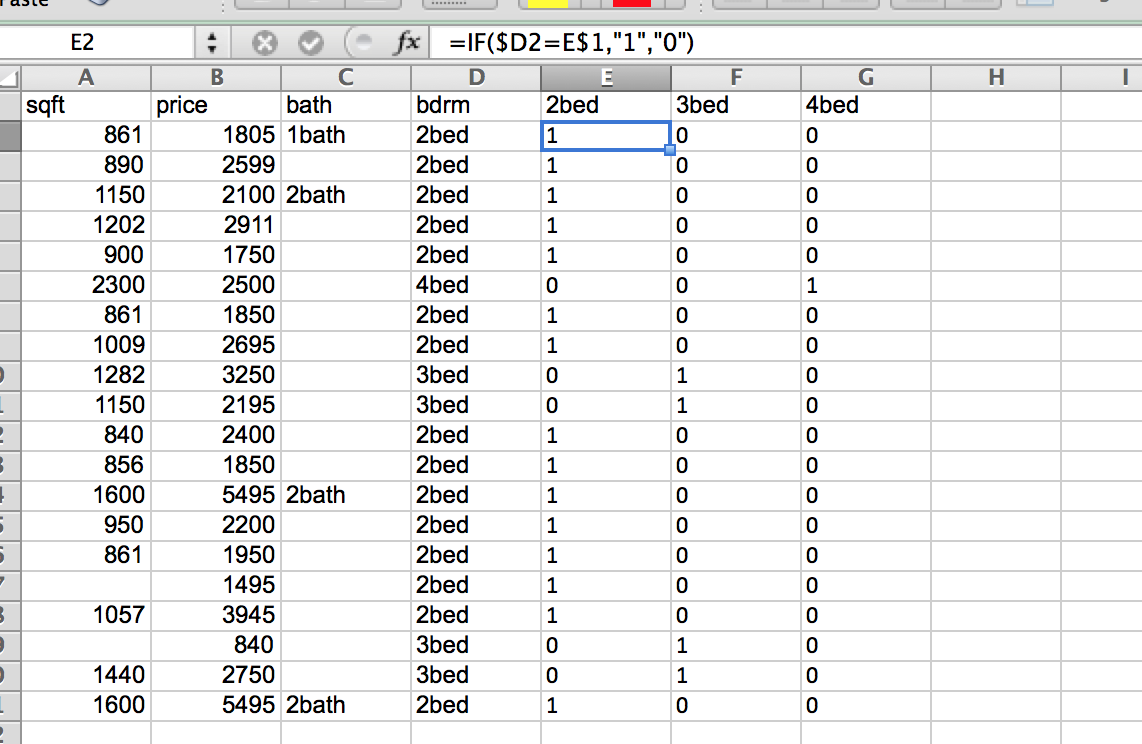
Next, it’s much easier to build a model when you’ve “dummy coded” the categorical values. So, I had to get the number of bedrooms split up. I’ve included a screenshot of what this looks like. But basically, I created a column called “2bed”, and put a 1 in the row if that was a 2 bedroom unit, 0 if it was something else. Then did the same for 3 bedrooms, and 4 bedrooms
Now, I just saved this to CSV.
For those of you who prefer the “just effin’ show me!” approach, here is the spreadsheet.
Building the Linear Model in R #
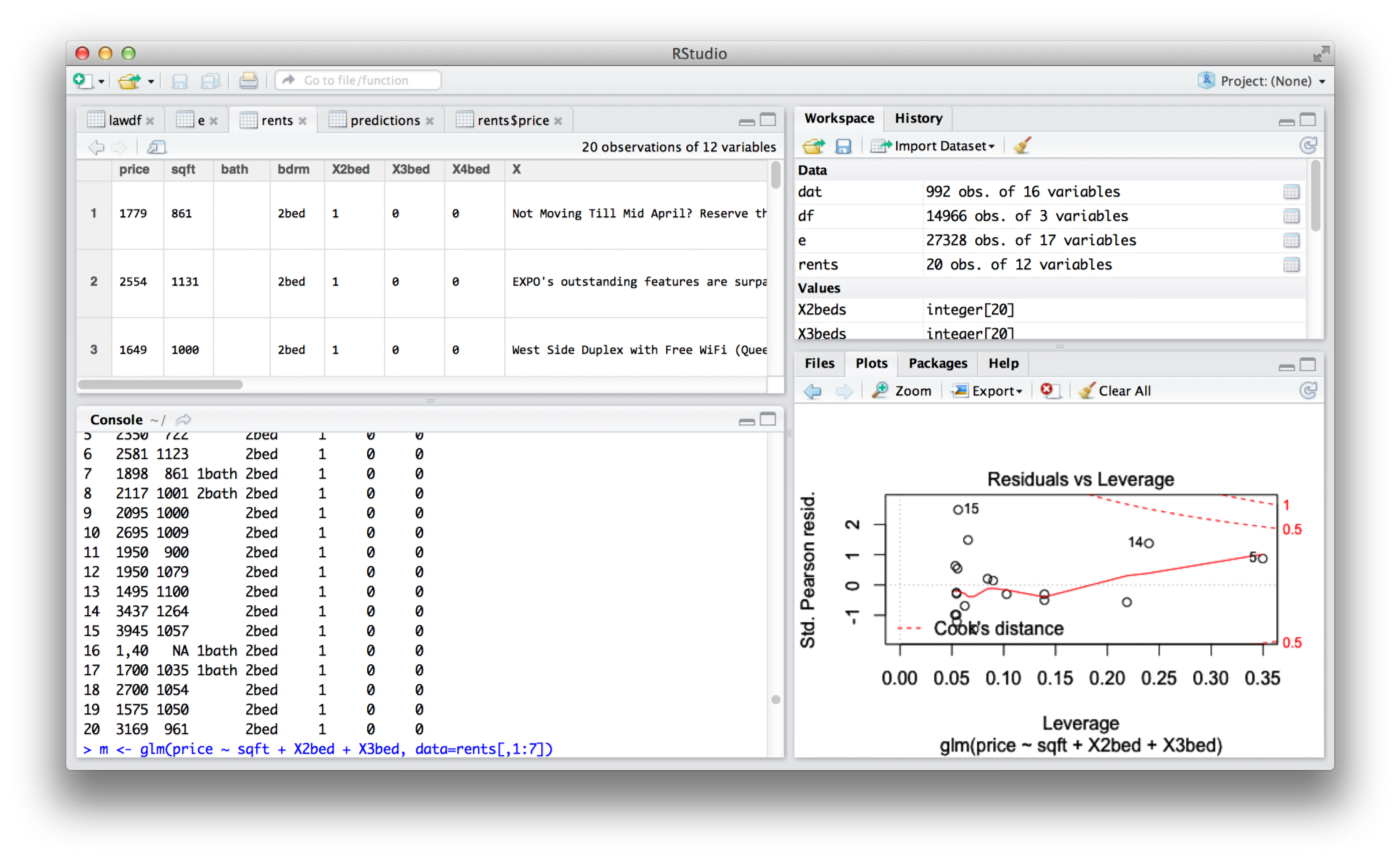
This might be cheating… but I’m actually using RStudio. It seems to make things a little easier to understand. Once I had usable data in a CSV, building the model was actually really easy. It was only a few lines!
rents = read.csv(“Documents/adam/house/qarents.csv”)
rents <- head(rents,20)
m <- glm(price ~ sqft + X2bed + X3bed, data=rents)
predict(m,data.frame(sqft=909,X2bed=1,X3bed=0,X4bed=0))
Et viola! I’ve got an answer for what I’m going to rent our condo for! (kind of)
Conclusion #
Based on my work, I think I’m actually going to ask for $100/month more than I had planned.
I noticed that professional property management companies are purposely posting units several times at slightly different locations, and us “do it yourselfers” stick to the rules (a little). Properties with professional management are typically higher-valued-units. Therefore, the ratio of high-to-low cost units on craigslist is disproportional to reality. So, I just kind of dropped my price a little.
Anyways, this was a fun Friday-night-while-watching-DS9-and-drinking-High-Life project.
Changes #
Google Spreadsheets will refresh the data from the RSS feed, so to streamline the process of getting new data, I quit using Excel and save to CSV straight from Google Spreadsheet.streamline the process of getting new data, I quit using Excel and save to CSV straight from Google Spreadsheet.